Visible to Intel only — GUID: mwh1410384869987
Ixiasoft
1.1. Failure Rates
1.2. Mitigating SEU Effects in Embedded User RAM
1.3. Mitigating SEU Effects in Configuration RAM
1.4. Internal Scrubbing
1.5. SEU Recovery
1.6. Intel® Quartus® Prime Software SEU FIT Reports
1.7. Triple-Module Redundancy
1.8. Evaluating a System's Response to Functional Upsets
1.9. CRAM Error Detection Settings Reference
1.10. Document Revision History
Visible to Intel only — GUID: mwh1410384869987
Ixiasoft
2.3.3. Using the Fault Injection Debugger
To use the Fault Injection Debugger, you connect to your device via the JTAG interface. Then, configure the device and perform fault injection.
To launch the Fault Injection Debugger, choose Tools > Fault Injection Debugger in the Intel® Quartus® Prime software.
Note: Configuring or programming the device is similar to the procedure used for the Programmer or Signal Tap Logic Analyzer.
Figure 12. Fault Injection Debugger
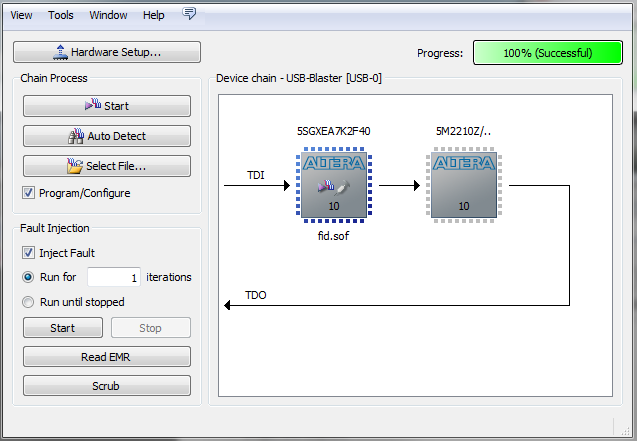
To configure your JTAG chain:
- Click Hardware Setup. The tool displays the programming hardware connected to your computer.
- Select the programming hardware you wish to use.
- Click Close.
- Click Auto Detect, which populates the device chain with the programmable devices found in the JTAG chain.