Visible to Intel only — GUID: irs1568053964166
Ixiasoft
1. Answers to Top FAQs
2. System Debugging Tools Overview
3. Design Debugging with the Signal Tap Logic Analyzer
4. Quick Design Verification with Signal Probe
5. In-System Debugging Using External Logic Analyzers
6. In-System Modification of Memory and Constants
7. Design Debugging Using In-System Sources and Probes
8. Analyzing and Debugging Designs with System Console
9. Intel® Quartus® Prime Pro Edition User Guide Debug Tools Archives
A. Intel® Quartus® Prime Pro Edition User Guides
2.1. System Debugging Tools Portfolio
2.2. Tools for Monitoring RTL Nodes
2.3. Stimulus-Capable Tools
2.4. Virtual JTAG Interface Intel® FPGA IP
2.5. System-Level Debug Fabric
2.6. SLD JTAG Bridge
2.7. Partial Reconfiguration Design Debugging
2.8. Preserving Signals for Debugging
2.9. System Debugging Tools Overview Revision History
3.1. Signal Tap Logic Analyzer Introduction
3.2. Signal Tap Debugging Flow
3.3. Step 1: Add the Signal Tap Logic Analyzer to the Project
3.4. Step 2: Configure the Signal Tap Logic Analyzer
3.5. Step 3: Compile the Design and Signal Tap Instances
3.6. Step 4: Program the Target Hardware
3.7. Step 5: Run the Signal Tap Logic Analyzer
3.8. Step 6: Analyze Signal Tap Captured Data
3.9. Other Signal Tap Debugging Flows
3.10. Signal Tap Logic Analyzer Design Examples
3.11. Custom State-Based Triggering Flow Examples
3.12. Signal Tap File Templates
3.13. Running the Stand-Alone Version of Signal Tap
3.14. Signal Tap Scripting Support
3.15. Signal Tap File Version Compatibility
3.16. Design Debugging with the Signal Tap Logic Analyzer Revision History
3.4.1. Preserving Signals for Monitoring and Debugging
3.4.2. Preventing Changes that Require Full Recompilation
3.4.3. Specifying the Clock, Sample Depth, and RAM Type
3.4.4. Specifying the Buffer Acquisition Mode
3.4.5. Adding Signals to the Signal Tap Logic Analyzer
3.4.6. Defining Trigger Conditions
3.4.7. Specifying Pipeline Settings
3.4.8. Filtering Relevant Samples
3.4.6.1. Basic Trigger Conditions
3.4.6.2. Nested Trigger Conditions
3.4.6.3. Comparison Trigger Conditions
3.4.6.4. Advanced Trigger Conditions
3.4.6.5. Custom Trigger HDL Object
3.4.6.6. Specify Trigger Position
3.4.6.7. Power-Up Triggers
3.4.6.8. External Triggers
3.4.6.9. Trigger Condition Flow Control
3.4.6.10. Sequential Triggering
3.4.6.11. State-Based Triggering
3.4.6.12. Trigger Lock Mode
3.4.6.11.5.1. <state_label>
3.4.6.11.5.2. <boolean_expression>
3.4.6.11.5.3. <action_list>
3.4.6.11.5.4. Trigger that Skips Clock Cycles after Hitting Condition
3.4.6.11.5.5. Storage Qualification with Post-Fill Count Value Less than m
3.4.6.11.5.6. Resource Manipulation Action
3.4.6.11.5.7. Buffer Control Actions
3.4.6.11.5.8. State Transition Action
3.8.1. Viewing Capture Data Using Segmented Buffers
3.8.2. Viewing Data with Different Acquisition Modes
3.8.3. Creating Mnemonics for Bit Patterns
3.8.4. Locating a Node in the Design
3.8.5. Saving Captured Signal Tap Data
3.8.6. Exporting Captured Signal Tap Data
3.8.7. Creating a Signal Tap List File
3.9.1. Signal Tap and Simulator Integration
3.9.2. Managing Multiple Signal Tap Configurations
3.9.3. Debugging Partial Reconfiguration Designs with Signal Tap
3.9.4. Debugging Block-Based Designs with Signal Tap
3.9.5. Debugging Devices that use Configuration Bitstream Security
3.9.6. Signal Tap Data Capture with the MATLAB* MEX Function
3.9.4.1.1. Partition Boundary Ports Method
3.9.4.1.2. Debug a Core Partition through Partition Boundary Ports
3.9.4.1.3. Export a Core Partition with Partition Boundary Ports
3.9.4.1.4. Signal Tap HDL Instance Method
3.9.4.1.5. Export a Core Partition with Signal Tap HDL Instances
3.9.4.1.6. Debug a Core Partition Exported with Signal Tap HDL Instances
4.1.1. Step 1: Reserve Signal Probe Pins
4.1.2. Step 2: Assign Nodes to Signal Probe Pins
4.1.3. Step 3: Connect the Signal Probe Pin to an Output Pin
4.1.4. Step 4: Compile the Design
4.1.5. (Optional) Step 5: Modify the Signal Probe Pins Assignments
4.1.6. Step 6: Run Fitter-Only Compilation
4.1.7. Step 7: Check Connection Table in Fitter Report
6.1. IP Cores Supporting In System Memory Content Editor
6.2. Debug Flow with the In-System Memory Content Editor
6.3. Enabling Runtime Modification of Instances in the Design
6.4. Programming the Device with the In-System Memory Content Editor
6.5. Loading Memory Instances to the ISMCE
6.6. Monitoring Locations in Memory
6.7. Editing Memory Contents with the Hex Editor Pane
6.8. Importing and Exporting Memory Files
6.9. Access Two or More Devices
6.10. Scripting Support
6.11. In-System Modification of Memory and Constants Revision History
7.1. Hardware and Software Requirements
7.2. Design Flow Using the In-System Sources and Probes Editor
7.3. Compiling the Design
7.4. Running the In-System Sources and Probes Editor
7.5. Tcl interface for the In-System Sources and Probes Editor
7.6. Design Example: Dynamic PLL Reconfiguration
7.7. Design Debugging Using In-System Sources and Probes Revision History
8.1. Introduction to System Console
8.2. Starting System Console
8.3. System Console GUI
8.4. Launching a Toolkit in System Console
8.5. Using System Console Services
8.6. On-Board Intel® FPGA Download Cable II Support
8.7. MATLAB* and Simulink* in a System Verification Flow
8.8. System Console Examples and Tutorials
8.9. Running System Console in Command-Line Mode
8.10. Using System Console Commands
8.11. Using Toolkit Tcl Commands
8.12. Analyzing and Debugging Designs with the System Console Revision History
8.5.1. Locating Available Services
8.5.2. Opening and Closing Services
8.5.3. Using the SLD Service
8.5.4. Using the In-System Sources and Probes Service
8.5.5. Using the Monitor Service
8.5.6. Using the Device Service
8.5.7. Using the Design Service
8.5.8. Using the Bytestream Service
8.5.9. Using the JTAG Debug Service
Visible to Intel only — GUID: irs1568053964166
Ixiasoft
8.3.1.3. Dashboard View
The Dashboard view allows you to visualize the changes to toolkit parameters over time.
The Dashboard provides options to view a line chart, histogram, pie chart or bar graph, and a data history. There is no limit imposed on the number of instances of the Dashboard view open at once. However, a performance penalty occurs if you update a high number of parameters at a high frequency simultaneously.
Figure 117. Dashboard View of the System Console
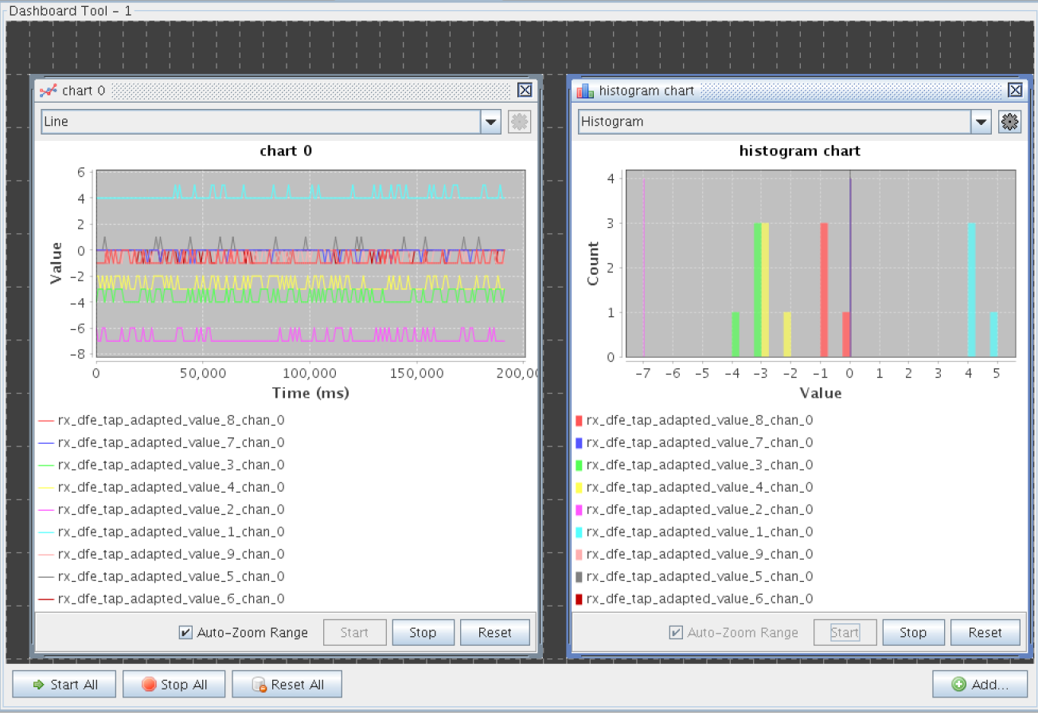
The Add Parameter dialog box opens when you click the Add button. Only those parameters that declare the allows_charting parameter property are available for selection in the Add Parameter dialog box.